Published: June 13, 2025
Written By: Ng Jun Hao

Background
Reliability tests conducted on a Todo Web App published on GitHub. I
have only selected one project for my very first tests.
Project
The project selected is https://github.com/gurkanucar/todo-app.
Technology Stack
ReactJS, Java SpringBoot, GraphQL
Application Model
Let’s breakdown the application model:
| Objective |
Step |
Description |
| View todos |
Refresh page |
User presses browser refresh button |
| Modify todos |
Create item |
User fill in title, description, priority
and press the add task button |
|
Edit item |
User press the edit button and change the
title |
|
Delete item |
User press the delete button |
The critical components are as follows:
| Critical |
Description |
Steps |
| Major |
Services that are responsible for viewing
and creating todos, and are critical (not optional) dependencies of core
features |
Refresh page, Create item |
| Medium |
Services that are non-critical
dependencies (graceful failover) of core features or are dependencies of
auxiliary features |
Edit item, Delete item |
| Minor |
All other services, typically internal or
unlaunched features |
None |
SLA (Service Level Agreement)
System administrator will ensure all Todo App users will have <5%
downtime on all features, <2000ms per feature request and <20000s
per 10k any feature request.
SLI (Service Level
Indicators)
The SLIs are Avaliability, Latency, Performance and Monitoring.
SLO (Service Level
Objectives)
The severity SLO (Avaliability) are as follows:
| Severity (Avaliability) |
Description |
| Major |
>100% impact to core features |
| Medium |
>50% impact to any core features OR
>100% impact to any secondary features |
| Minor |
>0% impact to any features |
The severity SLO (Latency) are as follows:
| Severity (Latency) |
Description |
| Major |
>7000ms per core feature request |
| Medium |
>4000ms per core feature request OR
>7000ms per secondary feature request |
| Minor |
>2000ms per any feature request |
| Acceptable |
>0ms per any feature request |
The severity SLO (Performance) are as follows:
| Severity (Performance) |
Description |
| Major |
>70000s per 10k core feature
request |
| Medium |
>40000s per 10k core feature request OR
>70000s per 10k secondary feature request |
| Minor |
>20000s per 10k any feature
request |
| Acceptable |
>0ms per any feature request |
The severity SLO (Monitoring) are as follows:
| Severity (Monitoring) |
Description |
| Major |
>20% downtime to core features in 1
hour |
| Medium |
>5% downtime to core features in 1 hour
OR >20% downtime to any secondary features in 1 hour |
| Minor |
>0% downtime to any features in 1
hour |
Methods
- Test cases are written using Jest
- Telemetry is captured using a python server and stored in
MongoDB
- Dashboard is displayed using Grafana
Test Cases
The following test cases were run to evaluate the reliability of the
Todo App:
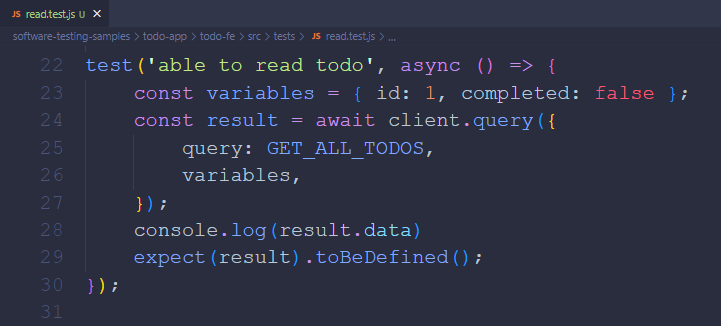
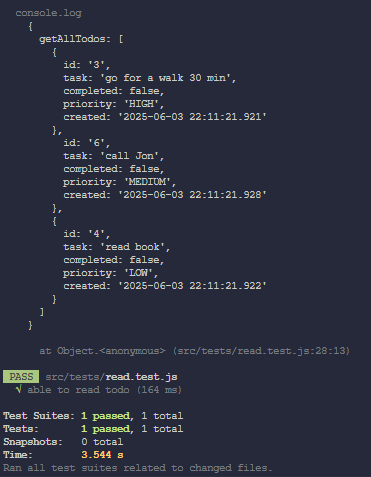
- Test Case 1: Able to view item
- Steps:
- Expected Result: Items are loaded
- Actual Result: Items are loaded (PASSED)
| Screenshots |
|
 |
 |
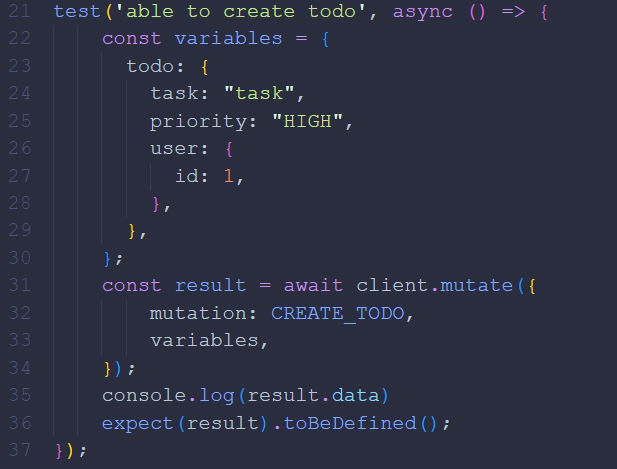
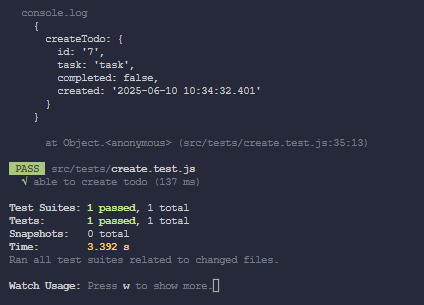
- Test Case 2: Able to create item
- Steps:
- Fill in the title and description
- Press the create item button
- Expected Result: Item is created
- Actual Result: Item is created (PASSED)
| Screenshots |
|
 |
 |
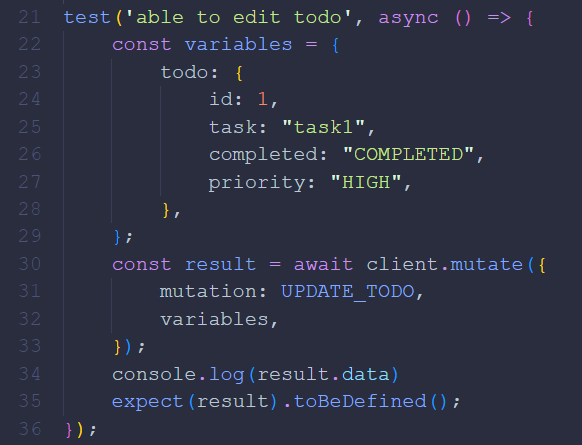
- Test Case 3: Able to edit item
- Steps:
- Presss the edit item button
- Modify a field
- Save the item
- Expected Result: Item is edited
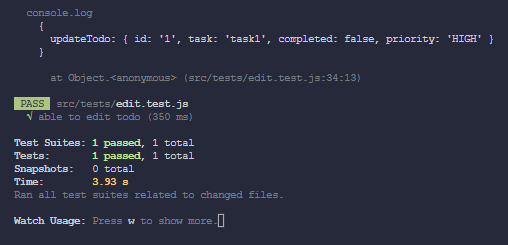
- Actual Result: Item is edited (PASSED)
| Screenshots |
|
 |
 |
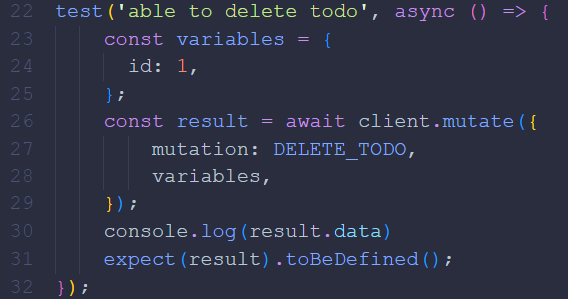
- Test Case 4: Able to delete item
- Steps:
- Press the delete item button
- Expected Result: Item is deleted
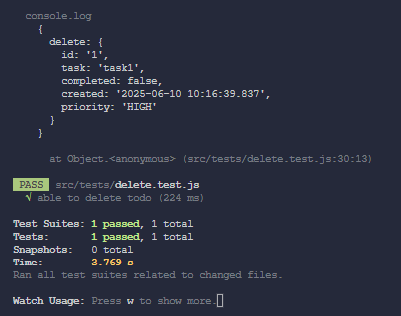
- Actual Result: Item is deleted (PASSED)
| Screenshots |
|
 |
 |
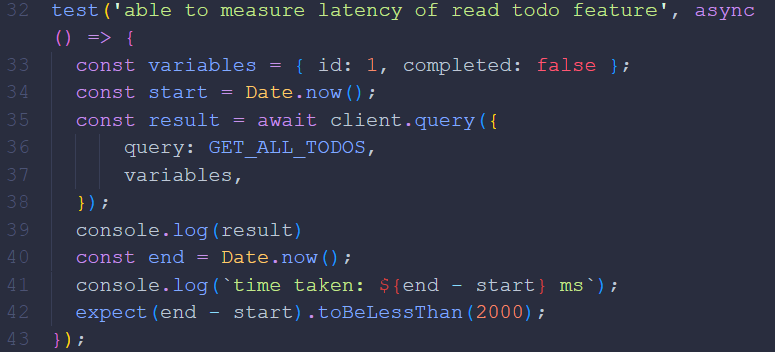
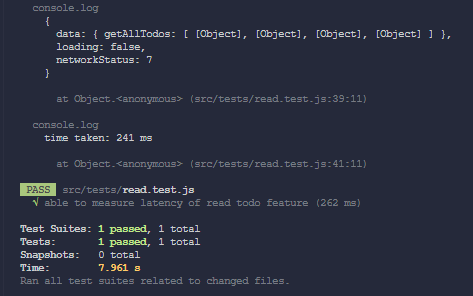
- Test Case 5: Measure latency of view item feature
- Steps:
- Refresh the page
- Measure the latency
- Expected Result: Latency for item to be loaded is <2000ms
- Actual Result: Latency is 241ms (PASSED)
| Screenshots |
|
 |
 |
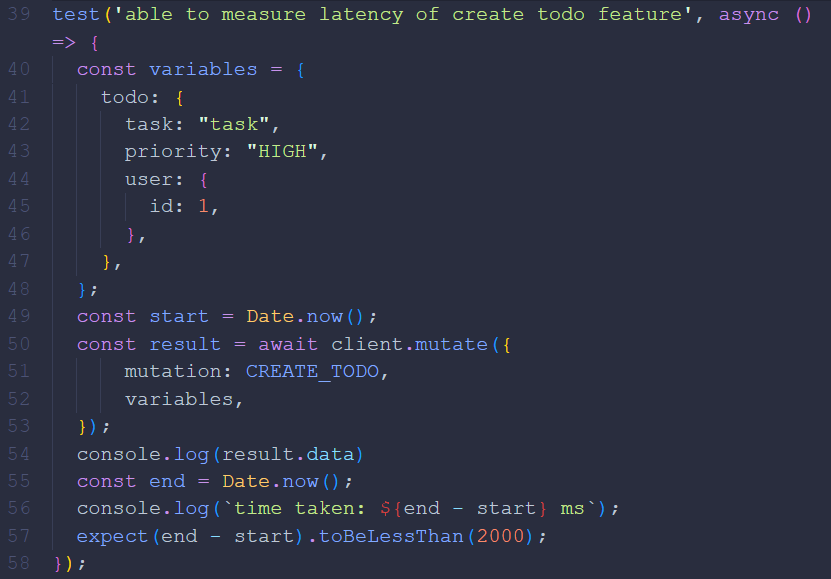
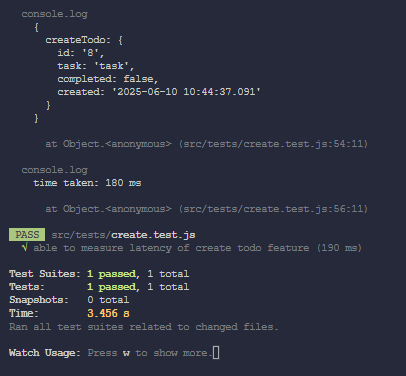
- Test Case 6: Measure latency of create item feature
- Steps:
- Fill in the title and description
- Press the create item button
- Measure the latency
- Expected Result: Latency for item to be created is <2000ms
- Actual Result: Latency is 180ms (PASSED)
| Screenshots |
|
 |
 |
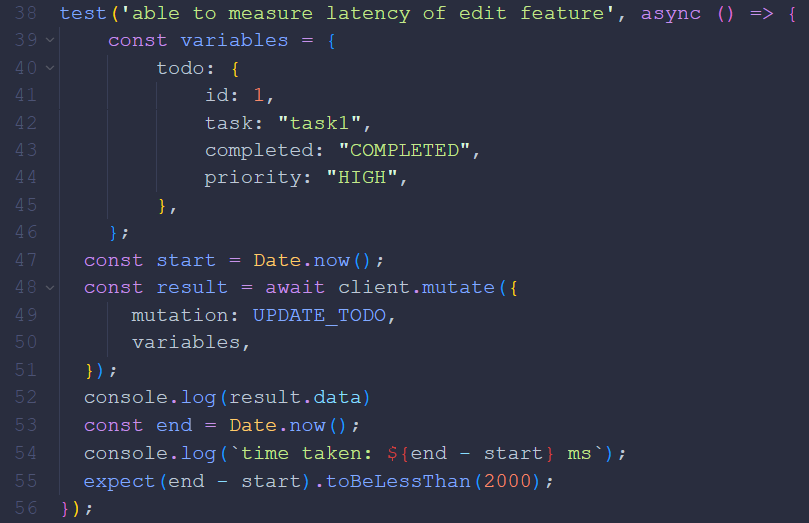
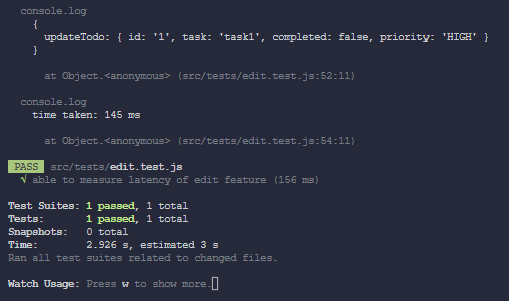
- Test Case 7: Measure latency of edit item feature
- Steps:
- Presss the edit item button
- Modify a field
- Save the item
- Measure the latency
- Expected Result: Latency for item to be edited is <2000ms
- Actual Result: Latency is 145ms (PASSED)
| Screenshots |
|
 |
 |
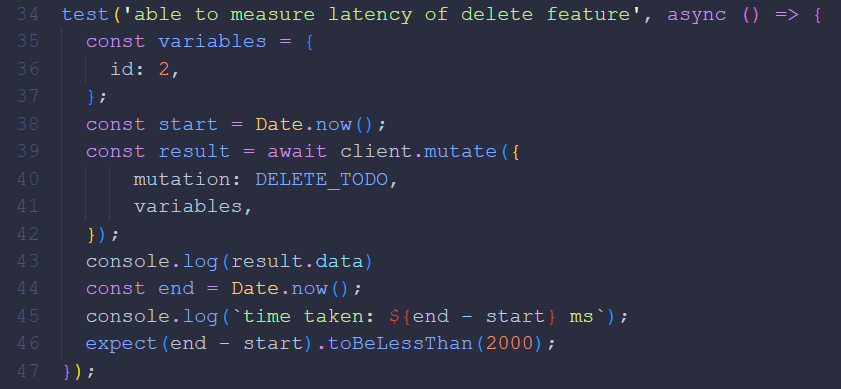
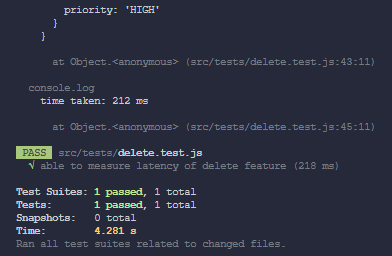
- Test Case 8: Measure latency of delete item feature
- Steps:
- Press the delete item button
- Measure the latency
- Expected Result: Latency for item to be deleted is <2000ms
- Actual Result: Latency is 212ms (PASSED)
| Screenshots |
|
 |
 |
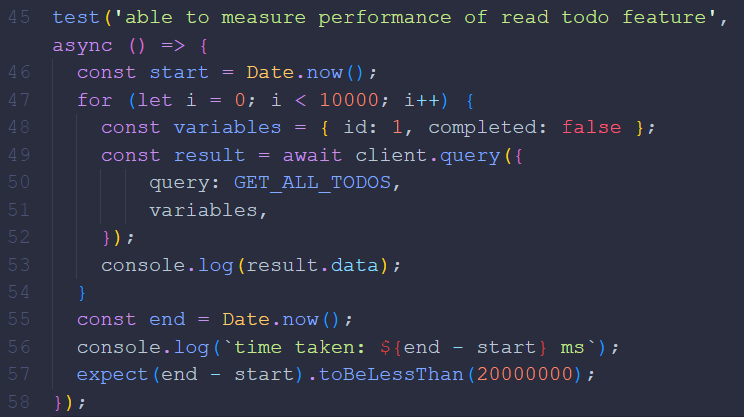
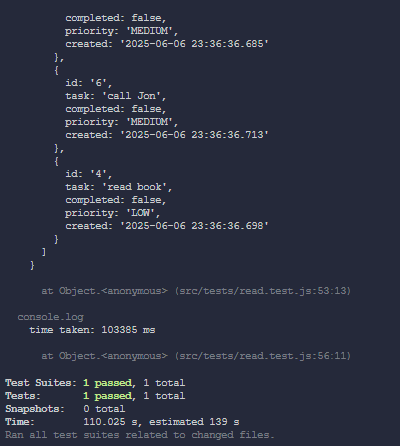
- Test Case 9: Measure performance of view item
feature during load testing
- Steps:
- Refresh the page
- Measure the performance
- Expected Result: Latency for item to be loaded is <20,000s per
10k requests
- Actual Result: Performance is 103,385ms per 10k requests
(PASSED)
| Screenshots |
|
 |
 |
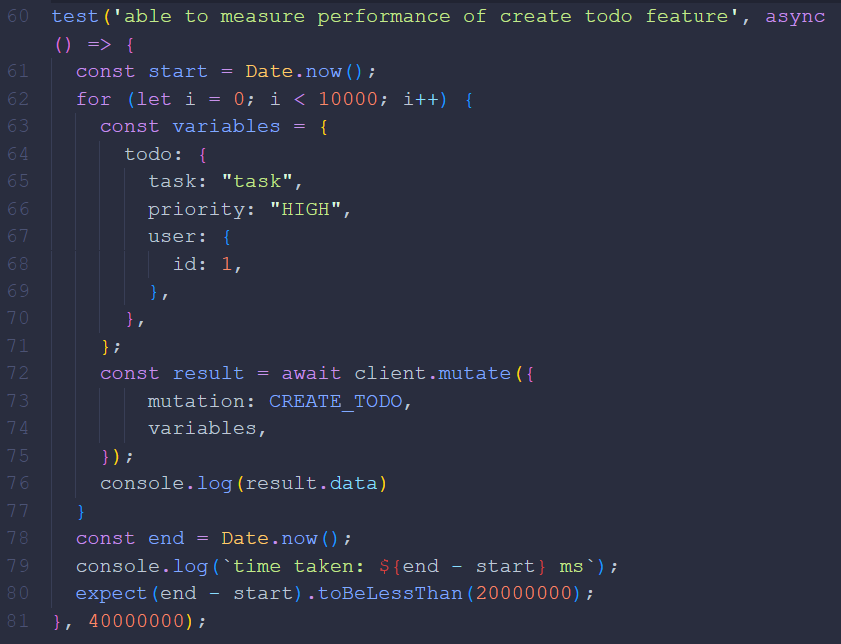
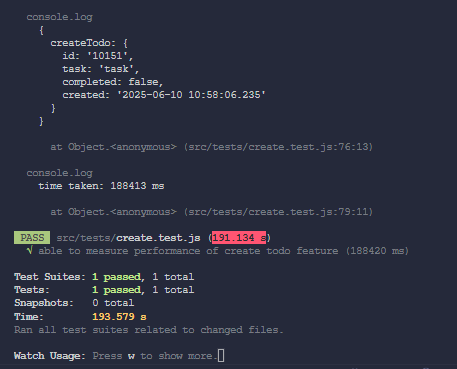
- Test Case 10: Measure performance of create item
feature during load testing
- Steps:
- Fill in the title and description
- Press the create item button
- Measure the performance
- Expected Result: Latency for item to be created is <20,000s per
10k requests
- Actual Result: Performance is 188,413ms per 10k requests
(PASSED)
| Screenshots |
|
 |
 |
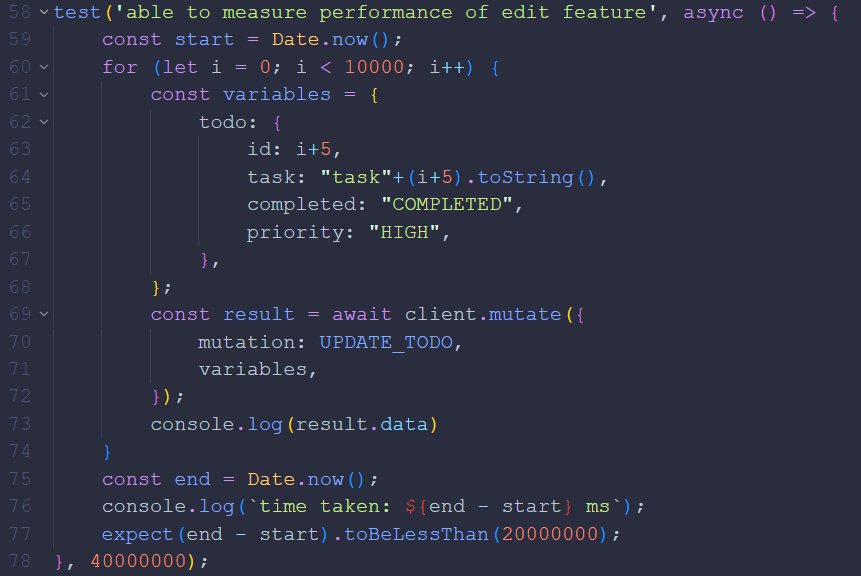
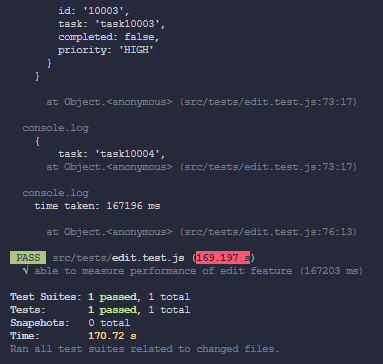
- Test Case 11: Measure performance of edit item
feature during load testing
- Steps:
- Presss the edit item button
- Modify a field
- Save the item
- Measure the performance
- Expected Result: Latency for item to be edited is <20,000s per
10k requests
- Actual Result: Performance is 167,196ms per 10k requests
(PASSED)
| Screenshots |
|
 |
 |
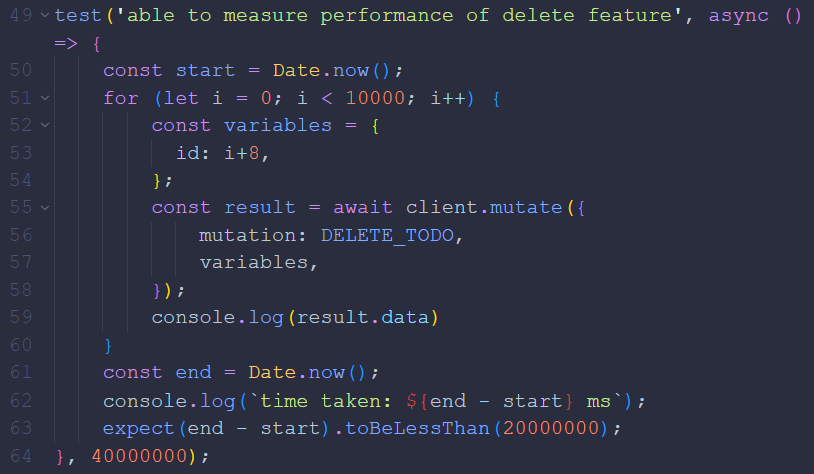
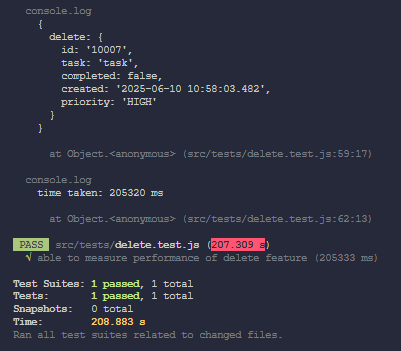
- Test Case 12: Measure performance of delete item
feature during load testing
- Steps:
- Press the delete item button
- Measure the performance
- Expected Result: Latency for item to be deleted is <20,000s per
10k requests
- Actual Result: Performance is 205,320ms per 10k requests
(PASSED)
| Screenshots |
|
 |
 |
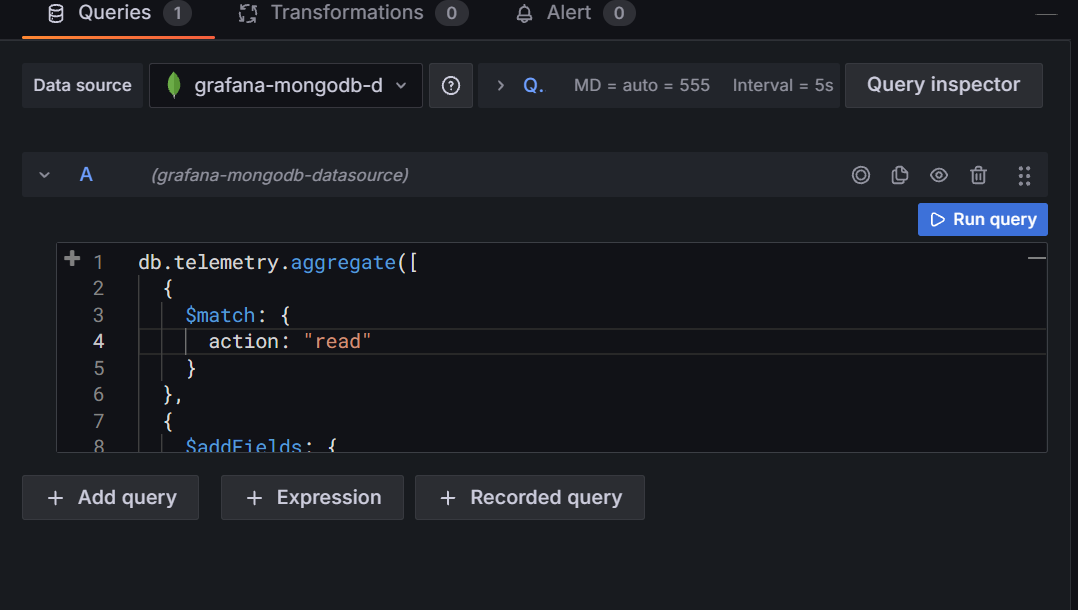
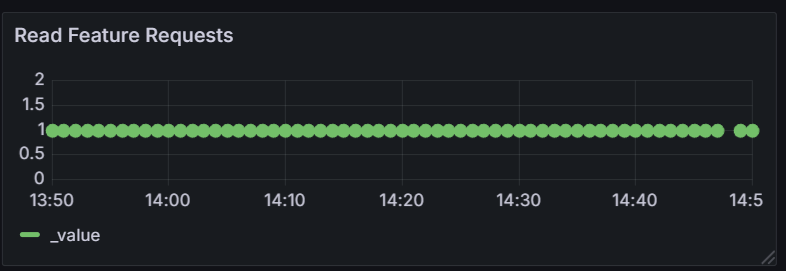
- Test Case 13: Monitor uptime of view item feature
for an hour
- Steps:
- Refresh the page
- Measure the uptime
- Wait one minute, repeat x60
- Expected Result: Downtime for view item feature is <5%
- Actual Result: Uptime is 59/60 - 98.33% (PASSED)
| Screenshots |
|
 |
 |
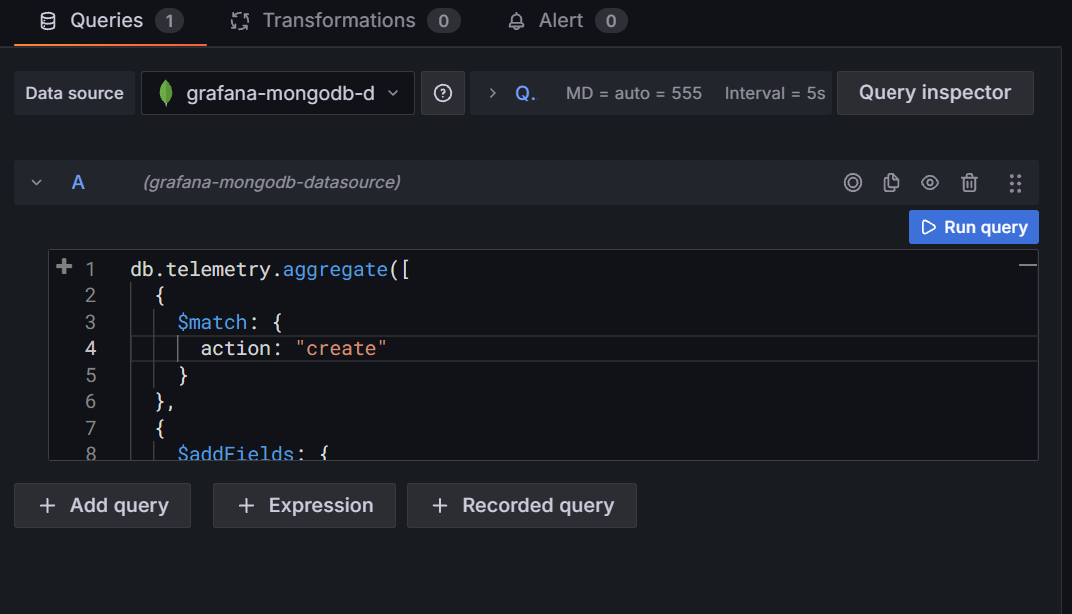
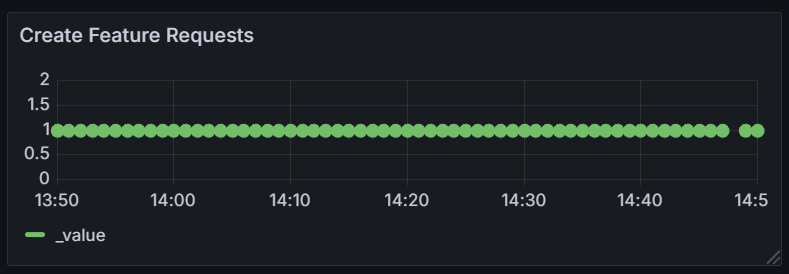
- Test Case 14: Monitor uptime of create item feature
for an hour
- Steps:
- Fill in the title and description
- Press the create item button
- Measure the uptime
- Wait one minute, repeat x60
- Expected Result: Downtime for create item feature is <5%
- Actual Result: Uptime is 59/60 - 98.33% (PASSED)
| Screenshots |
|
 |
 |
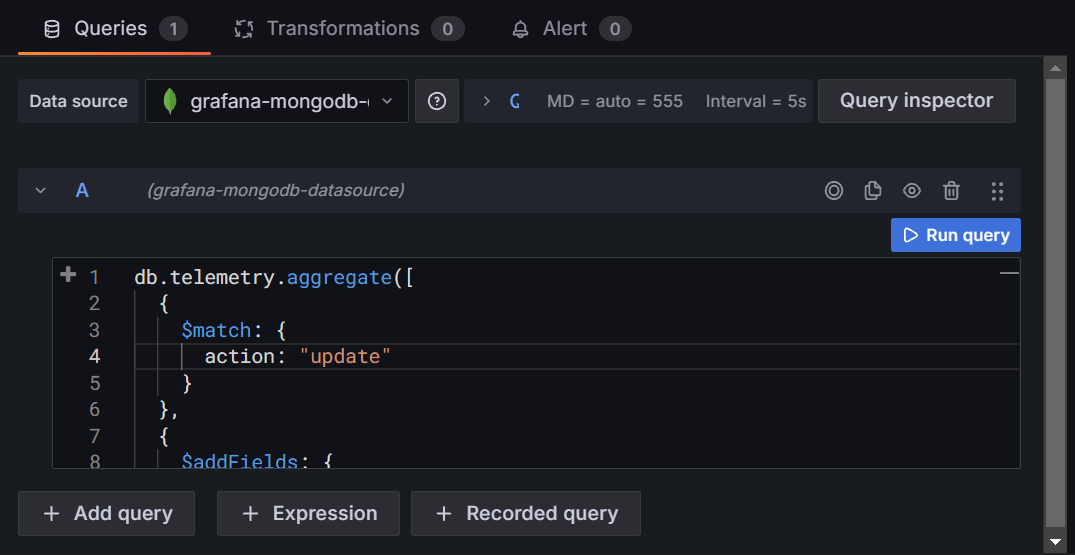
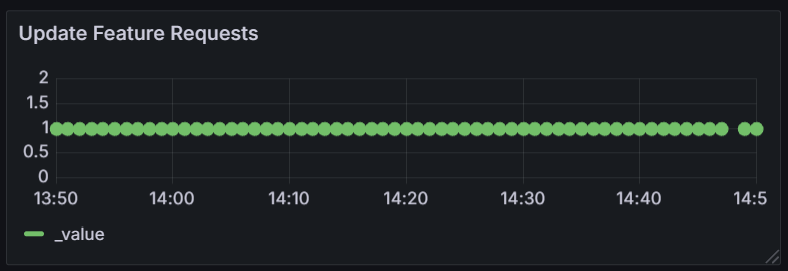
- Test Case 15: Monitor uptime of edit item feature
for an hour
- Steps:
- Presss the edit item button
- Modify a field
- Save the item
- Measure the uptime
- Wait one minute, repeat x60
- Expected Result: Downtime for edit item feature is <20%
- Actual Result: Uptime is 59/60 - 98.33% (PASSED)
| Screenshots |
|
 |
 |
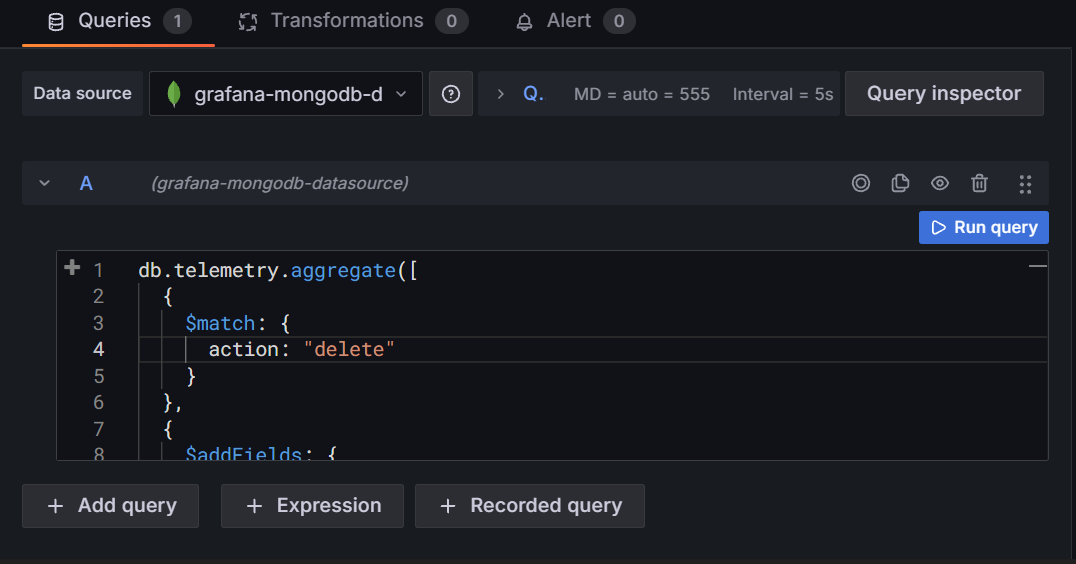
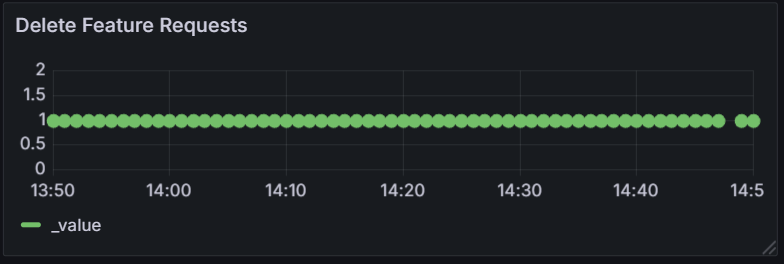
- Test Case 16: Monitor uptime of delete item feature
for an hour
- Steps:
- Press the delete item button
- Measure the uptime
- Wait one minute, repeat x60
- Expected Result: Downtime for delete item feature is <20%
- Actual Result: Uptime is 59/60 - 98.33% (PASSED)
| Screenshots |
|
 |
 |
Metrics
The severity summary (Avaliability) results are as follows:
| Feature |
Result |
| View Todo |
Items are loaded (PASSED) |
| Create Todo |
Item is created (PASSED) |
| Update Todo |
Item is edited (PASSED) |
| Delete Todo |
Item is deleted (PASSED) |
The severity summary (Latency) results are as follows:
| Feature |
Result |
| View Todo |
Latency is 241ms (PASSED) |
| Create Todo |
Latency is 180ms (PASSED) |
| Update Todo |
Latency is 145ms (PASSED) |
| Delete Todo |
Latency is 212ms (PASSED) |
The severity summary (Performance) results are as follows:
| Feature |
Result |
| View Todo |
Performance is 103,385ms per 10k requests
(PASSED) |
| Create Todo |
Performance is 188,413ms per 10k requests
(PASSED) |
| Update Todo |
Performance is 167,196ms per 10k requests
(PASSED) |
| Delete Todo |
Performance is 205,320ms per 10k requests
(PASSED) |
The severity summary (Monitoring) results are as follows:
| Feature |
Result |
| View Todo |
Uptime is 59/60 - 98.33% (PASSED) |
| Create Todo |
Uptime is 59/60 - 98.33% (PASSED) |
| Update Todo |
Uptime is 59/60 - 98.33% (PASSED) |
| Delete Todo |
Uptime is 59/60 - 98.33% (PASSED) |
Conclusion
Severity summary (Avaliability):
| Classification |
Reason |
| Minor |
All features are working. |
Severity summary (Latency):
| Classification |
Reason |
| Acceptable |
Latency of all features is
<2000ms. |
Severity summary (Performance):
| Classification |
Reason |
| Acceptable |
Performance of all features is <20,000s
per 10k requests. |
Severity summary (Monitoring):
| Classification |
Reason |
| Minor |
Uptime for all features is 59/60 - 98.33%,
<5% downtime. Missing one request from all features at 14:48. |
Summary
This is just a test conducted on a simple web app. I hope to run
larger tests on bigger projects in the future, trying out more tools and
frameworks.
Navigation
Back to home


